Faction win rate tells us how an army performed, but it does not tell us how that performance was distributed among the people playing it. That distinction has been bothering me for a while.
Two armies can both finish a tournament season around 50%, but get there in completely different ways. One might produce a large pile of 2-3 and 3-2 records. Another might regularly put one player near the top while several others struggle. Those armies have the same average, but they probably do not feel the same to play. Call it the “Are Ratkin good or is it a small sample size with Sean Troy and some other people running up the Ws?” problem.
So I went back through the 2026 4th Edition tournament data and tried to measure something different:
Which factions are producing relatively consistent results across their players, and which have a wider range of outcomes?
The answer is interesting, although there is an important limitation right up front. I cannot tell you that an army is easy to play. I cannot tell you that another faction has a high skill ceiling. And I definitely cannot tell you that elite players are carrying a particular army. We do not yet have a good independent player-rating system attached to these results (though Europe is doing its part). What we can measure is the spread we actually see. And that already tells us something useful.
The dataset
This analysis uses 17 Kings of War 4th Edition tournaments played between January 17 and July 12, 2026, shown on https://kow-dataset.web.app/. The underlying result file contains 1,485 player-perspective game records. Using the tournament list database, I was able to reconstruct those results into:
- 321 player-event entries
- 249 individual players
- 311 player-event entries with at least three games
- 196 with at least five games
Measuring consistency
A raw tournament record creates a problem. If somebody appears in only three games, a 3-0 record gives them a 100% score rate. Somebody else can go 0-3 and land at 0%. Those results are real, but treating three games as enough evidence to define the faction’s ceiling or floor would be silly. I therefore pulled every player-event result toward 50% using a five-game neutral prior (if you’re active on boardgamegeek.com, you should be familiar with this approach of rating games to smooth out early outliers). In plain English, short tournament records get moderated more heavily. Longer records retain more of what actually happened.
From those adjusted player-event results, I calculated the middle 50% of each faction’s performances. The distance between the 25th and 75th percentiles is the Adjusted IQR. A smaller number means results were more tightly clustered. A larger number means players using that faction produced a wider range of tournament outcomes. Across factions with adequate samples, the median was 11.8 percentage points. That gives us a useful dividing line for this particular dataset.
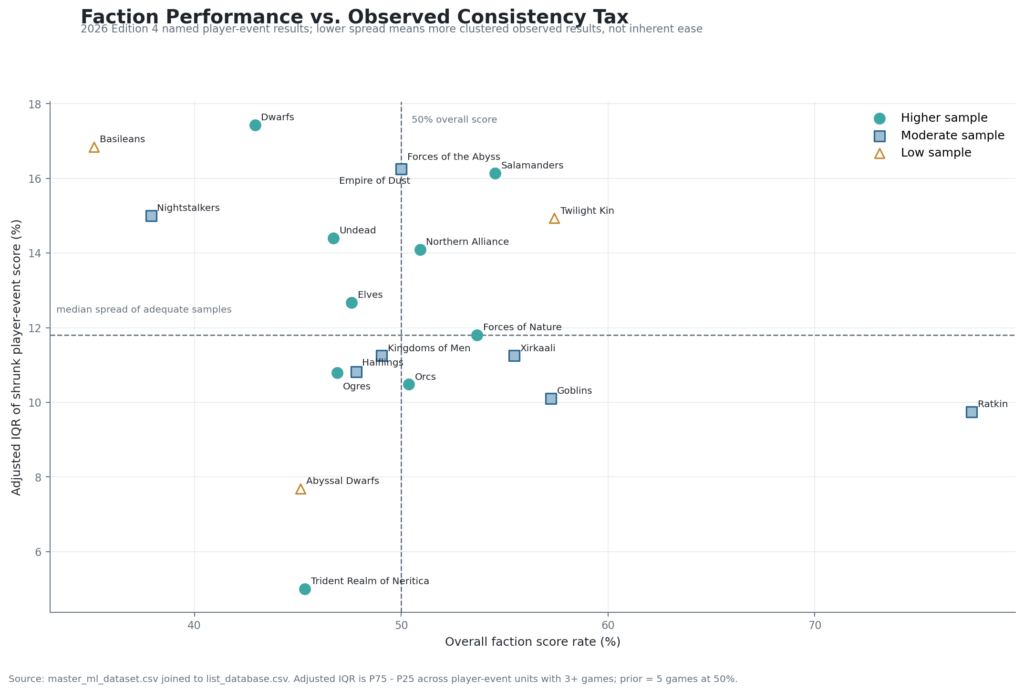
Ratkin and Goblins combine strength with relatively narrow spreads
Ratkin are still the obvious place to start. They posted a remarkable 77.6% raw score rate in this dataset. Even after shrinking individual tournament performances toward average, their weighted player-event score remained 64.2%. Their Adjusted IQR was only 9.7 percentage points.
Goblins show a similar, although much less extreme, pattern. They scored 57.2% overall, while their Adjusted IQR was 10.1 points. Both sit on the strong side of overall performance and the narrow side of observed result spread.
A faction occasionally producing a monster tournament result is one thing. A faction producing strong results without an unusually large separation among its player-event performances is a different signal. I would still be careful here. Ratkin and Goblins both move somewhat under the robustness tests, so I am not claiming that either army is inherently forgiving.
The current data simply says their strong 2026 results have not depended on an especially wide distribution of tournament performances. (Again, all the usual caveats about sample size, revisiting in the future, etc.).
Salamanders look different
Salamanders are one of the more interesting contrasts. Their overall score rate is a healthy 54.5%. But their Adjusted IQR is 16.1 percentage points, well above the 11.8-point median. That puts Salamanders in the unusual combination of strong overall performance and a relatively wide observed spread (in layman’s terms, this means that some Salamander tournament entries have performed very well, while others have not been nearly as successful).
There are several possible explanations: The faction could reward particular list structures. Matchups might matter more. Player experience could matter. Different event fields could be pulling results apart.
The current analysis cannot separate those explanations. What it can tell us is that the 54.5% headline average hides considerably more variation than the Goblin or Ratkin numbers do. That would make Salamanders one of the factions I would most like to revisit once we have independent player ratings, if the European elo ratings ever make it over to the US.
Dwarfs have a wide spread and weak overall results
Dwarfs land in a less comfortable part of the chart. Their overall score rate is 42.9%, while their Adjusted IQR is 17.4 percentage points, the widest among the adequately sampled factions in the main ranking. The context-adjusted version remains wide at 16.0 points. That does not *necessarily *mean Dwarfs are a “high-skill army.” It means the Dwarf entries in this tournament sample have combined below-average overall performance with a fairly wide range of individual event results.
Some players are clearly finding considerably more success than others. For Dwarf players, I think that makes list construction worth studying more closely. Are the successful lists built differently? Are they leaning harder into shooting, infantry, scenario play, or particular support packages? Do they come disproportionately from certain tournament environments? Those are questions the current spread analysis raises rather than answers.
Trident Realm is the clearest consistency result
The most statistically durable result belongs to Trident Realm. Their overall score rate is only 45.3%. Their Adjusted IQR, however, is just 5.0 percentage points, by far the narrowest among the better-sampled armies. More importantly, Trident is the only faction classified as stable across the robustness checks used in this analysis. The context-adjusted spread remains relatively narrow at 7.8 points. That gives us a fairly clear description of what happened in this dataset:
Trident Realm players tended to finish in a relatively tight performance band, and that band was below average.
That might sound like faint praise, but it is useful information. A narrow spread is not automatically good. Consistency around 45% is still 45%. This is why I would avoid describing this analysis as identifying the easiest armies. Trident provides the cleanest example of the problem. The faction’s results are consistent, but they are consistently a little weak.
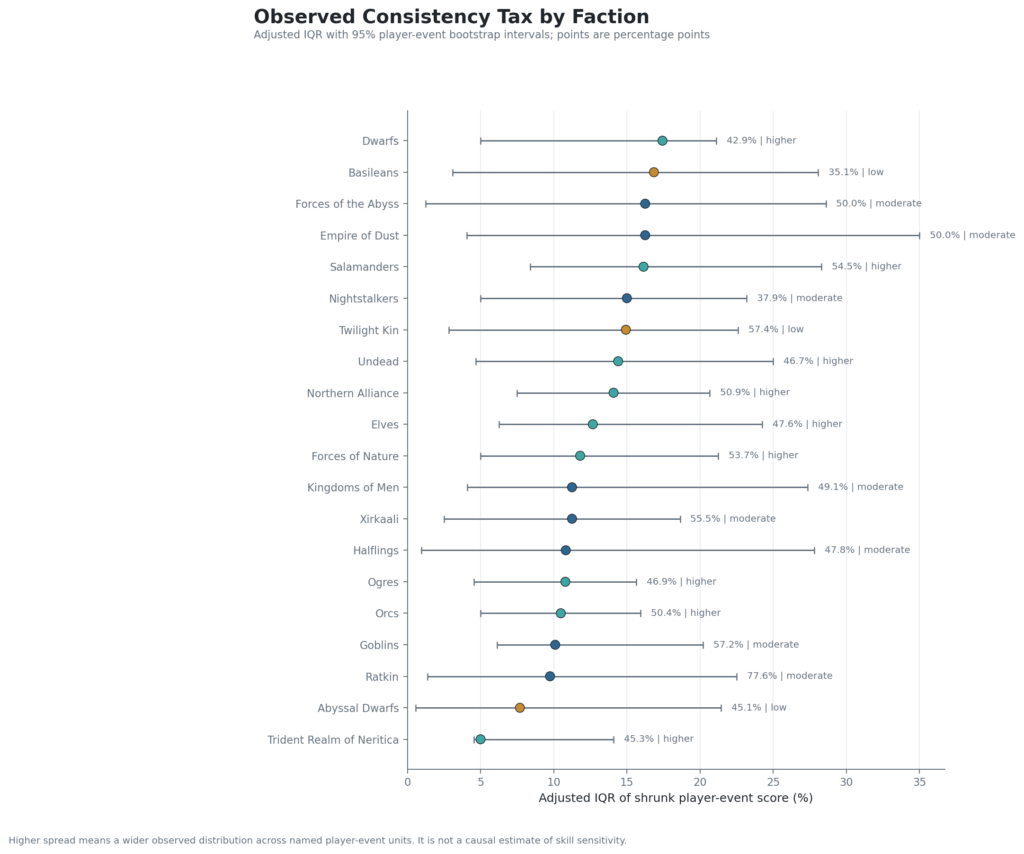
Caption: Trident Realm produced the narrowest adjusted result spread in the 2026 sample, while Dwarfs, Empire of Dust, Forces of the Abyss, and Salamanders showed some of the widest.
Orcs are surprisingly ordinary
I’ve written a lot about Orcs in 4th edition. Orcs might be the result I find most useful. Their overall score rate is 50.4%. Their Adjusted IQR is 10.5 points. So far, that is an extremely ordinary statistical profile. They are basically average in overall performance and slightly tighter than average in player-event spread.
That continues to fit what I have seen in the early 4E tournament data: Orcs look good. They have strong tools. People understandably worry about what the faction can do. The actual results still are not showing anything close to runaway dominance (and nerfing Thonaar would have been a mistake). This analysis adds another piece to that picture. Orc results are not hiding a huge split where a handful of players are crushing events while everyone else fails. The observed distribution is fairly compact.
For now, I would continue treating Orcs as a good faction that deserves respect rather than evidence of a balance problem.
Adjustment changes the picture quite a bit
One reason I prefer the adjusted version is that the raw results exaggerate the apparent differences between armies. Before shrinkage:
- Dwarfs had a 36.9-point IQR.
- Salamanders were at 35.2.
- Empire of Dust and Forces of the Abyss were both around 36.7.
- Trident was at 10.0.
After pulling short tournament records toward average:
- Dwarfs fall to 17.4.
- Salamanders to 16.1.
- Empire of Dust to 16.2.
- Forces of the Abyss to 16.2.
- Trident to 5.0.
The ordering still contains useful information, but the scale becomes far more believable. A three-game tournament should influence the analysis. It should not be treated as proof that someone is a 100% or 0% player.
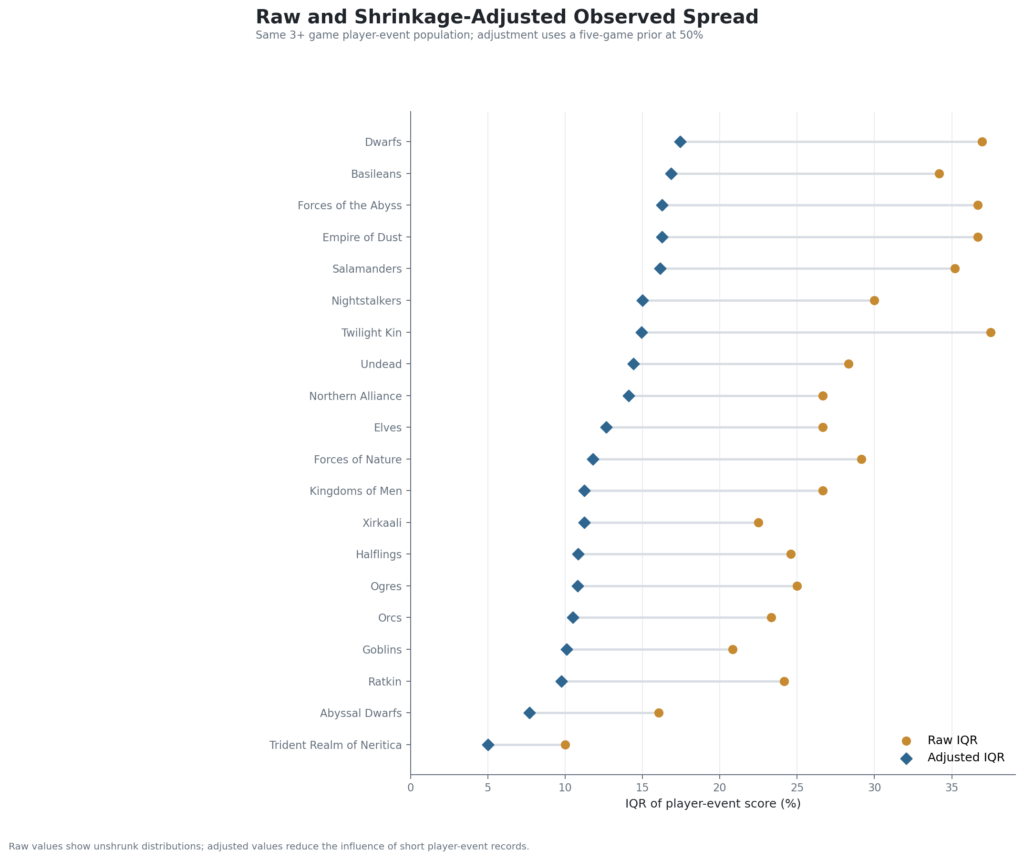
Caption: Shrinking short tournament records toward 50% cuts down the extreme faction spreads while preserving the broader differences between armies.
Most of these rankings are still signals, not tiers
This is probably the most important caveat in the article. I tested the results using different amounts of shrinkage, context adjustment, incomplete-event removal, different minimum-game requirements, and tournament-level bootstrap samples. Only Trident Realm remained clearly stable under the full set of checks. Across the different three-, five-, and ten-game priors, a faction’s spread could shift by as much as 11.8 percentage points. The largest difference between the primary calculation and the context-adjusted version was 4.0 points.
So I would not turn this into a tier list. Dwarfs being at 17.4 while Salamanders sit at 16.1 does not establish that Dwarfs are definitively more variable. The better interpretation is broader:
- Some factions currently show relatively wide result distributions.
- Others appear more tightly clustered.
- Overall strength and consistency do not necessarily move together.
- Several apparent differences need more tournament data before we trust their exact ordering.
What does this mean for players?
I think this introduces another question worth asking when evaluating a faction. Win rate tells you how the field performed. Result spread tells you how similar those performances were. Those are different pieces of information.
If a faction is strong and tightly clustered, like Ratkin or Goblins in this sample, I pay more attention to the army itself. Strong results are showing up across a relatively compressed distribution.
If a faction performs reasonably well but has a much wider spread, like Salamanders, I want to understand what separates the successful entries from the unsuccessful ones. That might be player experience. It might be list construction. It might be matchups. It might simply be noise. The useful next step is figuring out which.
And if an army has a narrow spread but below-average results, as Trident currently does, consistency by itself is not much consolation. The question becomes whether the whole distribution can move upward as players solve the faction.
Where this goes next
If you’re building lists, coaching players, or just trying to understand your faction better, this is the kind of lens I’d encourage you to start using alongside win rate: not just how good is this army on average, but how much does it vary depending on who is piloting it and in what context.
And if you’re sitting on more event data, player IDs, or even just local meta results, I’d love to expand this further–because the real answer to “consistency tax” will only show up once we can track players over time, not just armies in isolation.