I continue to be swamped with my new role but am trying to get in a few games here and there and get back into the blogging side of things. For several years now, I’ve compiled pre-tournament summaries that look at the baseline characteristics of lists: number of drops, number of scoring drops, unit strength, expected damage output, average speed, and so on. About a year ago I built out an additional module to track tournament outcomes (which is particularly easy if they’re posted on the Mantic Companion site). I then combine these data sources into a single dataset that looks at all the measurable characteristics and how that ties to on-table performance. To uncover exactly what separates winning army lists from those less successful, I analyzed the dataset of approximately 2,600 tournament matches, capturing extensive metrics including unit strength, scoring unit counts, total attack volumes, and various specialized unit roles.
Why These Metrics?
Metrics like unit strength, scoring units, and total attack volume directly influence game dynamics, from objective control to combat effectiveness. Understanding their statistical relationship with wins gives players quantifiable levers to enhance their competitive edge. When I’ve looked at this in the past, the sample size was too small to draw meaningful conclusions. But as I continue to add more data to the dataset, I’m hoping to uncover better insights.
Methodology
The dataset contained outcome labels (win, loss, draw) and numeric features from each player’s list and their opponents’. After converting outcomes into a binary “win/not-win” variable, I employed several statistical tools. None of these is perfect on its own, but each provides a useful lens for evaluating the data:
- Correlation Analysis: Identified linear relationships between each metric and match outcomes.
- Logistic Regression: Revealed how strongly each factor individually influenced winning odds.
- Random Forest Classifier: Captured complex interactions between variables and ranked features by predictive importance.
- Permutation Importance: Confirmed each factor’s real-world predictive power by testing impact when randomized.
Core Findings: Top 5 Factors Driving Wins
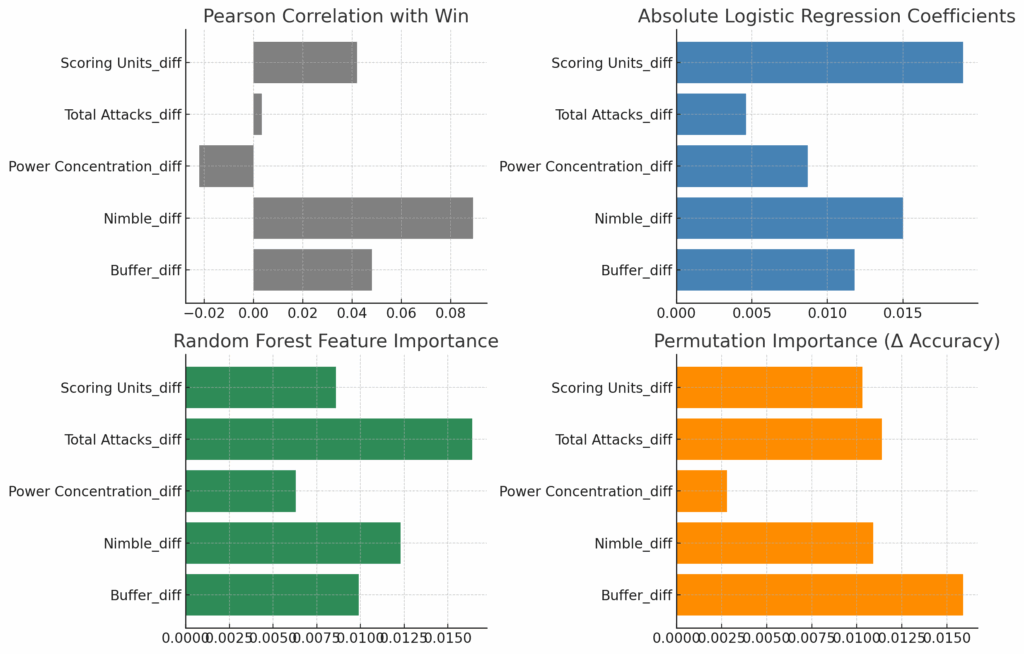
Each of these five insights emerged consistently across every statistical method I ran—and they were the only factors to do so. They (1) correlated most strongly with “win” in raw linear analysis; (2) carried the highest absolute weights in logistic regression; (3) scored highly in the random forest’s feature importance; and (4) caused the largest drop in model accuracy when permuted. Here’s how they ranked across each method:
| Feature | Pearson r | Logistic Coeff (abs) | RF Importance | Perm Importance (Δ Accuracy) |
| Scoring Units_diff | 0.042 | 0.019 | 0.0086 | 0.0103 |
| Total Attacks_diff | 0.0034 | 0.0046 | 0.0164 | 0.0114 |
| Power Concentration_diff | –0.022 | 0.0087 | 0.0063 | 0.0028 |
| Nimble_diff | 0.089 | 0.0150 | 0.0123 | 0.0109 |
| Buffer_diff | 0.048 | 0.0118 | 0.0099 | 0.0159 |
How to read this:
- Pearson r = linear correlation with win-rate
- Logistic Coeff = strength of contribution in logistic regression
- RF Importance = how much the Random Forest relied on it for decision-making
- Perm Importance = drop in model accuracy when the feature is randomized
All five ranked in the top 10–20 (of over 130 factors) for at least two methods, and three (Scoring Units, Total Attacks, Buffer) were in the top five for permutation importance. That cross-check is what clinched them as my core strategic insights:
- Scoring Unit Differential: Armies with more scoring units than their opponents had the strongest statistical link to victory.
- Attack Volume Advantage: Lists generating significantly more attacks consistently outperformed their peers. Note that this matters more than the expected damage value–sheer weight of attacks impacts performance much more than the quality or expected outputs of those attacks.
- Power Concentration: Focusing offensive capability in fewer, more impactful units rather than spreading thinly correlated positively with winning (though admittedly not as much as the other factors here).
- Nimble Units: Lists that had an advantage in Nimble units performed better, presumably due to maneuverability or pressure.
- Buffers: Lists maintaining a higher presence of buffer units (typically spellcasters with heal or bane chant) saw a clear competitive advantage.
Illustrative Examples
- High Scoring Unit Advantage: Lists featuring 2-3 more scoring units than opponents showed an 8-12% increase in win rate.
- Attack Volume Edge: Armies generating over 20% more attacks typically enjoyed around a 10% higher winning percentage.
- Defensive Buffer: Armies including 1-2 additional defensive support units frequently outlasted opponents in tight matches.
Army Specific Applications
I also looked at whether different factions are impacted differently by list-building features. The sample sizes aren’t huge, so there’s some noise, but a few trends stood out with statistical significance. Ogres perform much better when they include meaningful healing—lists with a healing edge win at a much higher rate. Goblins benefit from swarming the board and scoring objectives—more drops, more wins. Varangur tends to do well when they bring more Inspiring sources, reinforcing their otherwise aggressive playstyle. Northern Alliance performs better with more buffer units (shoutout to Ice Queens), and Twilight Kin—who are notoriously fragile—win 70% of the time when they have more nerve than their opponent, compared to just 48% when they don’t.
Practical Applications
Based on these findings, here are clear takeaways to refine your competitive strategy:
- Prioritize Scoring Units: Aim for at least a slight scoring-unit advantage to consistently improve your win probability. The common trope about 40-50mm square base nimble scoring units is real. Make sure you’re focusing on these scorers, not just on combat output or raw unit strength.
- Optimize Attack Output: Focus your list design around maximizing total attack volume. Units that offer high-volume attacks consistently elevate overall performance. This matters more than the quality of the attacks.
- Strategic Concentration: Centralize your attacking power into fewer, more effective units to punch through critical enemy targets decisively. You want gladiators, not bricklayers, as your hammers.
- Counter Enemy Mobility and Disruption: Incorporate explicit counters or tactics to neutralize enemy Nimble units, disrupting their tactical advantages, or bring your own and use them well.
- Build a Reliable Buffer: Always allocate points for units that increase your army’s resilience and defensive staying power. That mage with bane chant and heal is worth its weight in gold.
Next Steps for Competitive Players
Now that we’ve seen which traits truly drive wins, in Part II on list building we’ll turn those insights into a step‑by‑step list‑building playbook. You’ll learn how to balance threat projection, scoring depth, durability, chaff, synergy—and make every principle count at your next GT.