In a previous article, I took a look at how to evaluate unit-cost effectiveness. As a next step to that analysis, I wanted to compare armies to each other to determine which ones offer the most value in Kings of War. Here’s how I approached this analysis:
Methodology Summary
Initial Data Preparation
I started with a robust dataset derived from 1.25 million combat simulations in Kings of War. This dataset included various metrics for each unit, such as Elo rating and points cost.
Two Key Metrics
Elo per Point: Measures the cost-effectiveness of each unit by dividing its Elo rating by its points cost. This metric provides a direct insight into how much performance each unit brings relative to its cost.
Elo Difference: Calculated using a regression model, this metric reflects the difference between a unit’s actual Elo rating and its expected performance based on cost and size. A positive Elo Difference indicates a unit performing better than expected, while a negative value suggests underperformance.
Standardization and Combination of Metrics
To create a combined measure of cost-effectiveness, I first standardized both metrics (Elo per Point and Elo Difference) to ensure they were on the same scale.
Then, I combined them using a weighted approach, assigning 60% weight to Elo per Point and 40% to Elo Difference. This resulted in a ‘Combined Cost-Effectiveness’ metric for each unit, balancing both cost and performance expectations.
Army Comparison Strategy
Recognizing the diverse composition of armies in Kings of War, where a mix of units of various sizes and types are utilized, I tailored the selection of units from each army to better reflect a balanced and strategic army composition. The revised selection criteria include:
- Top 3 Regiments (R)
- Top 2 Hordes (H)
- The top 2 highest-rated units from the remaining categories combined: Troops (T), Monsters (M), War Engines (WE), Titans (Ti), and Legions (L), regardless of their specific category.
This approach ensures that the analysis captures the most cost-effective and impactful units across different roles and sizes, mirroring the choices players face in constructing their armies. In the absence of this, an army with one or two very cost-effective troops or monsters would jump to the top of the list, which isn’t realistic considering the unlocking rules. Alternatively, I could consider the average cost-effectiveness of every unit in the army, but most armies are not running 20+ different types of units so much as focusing on a subset of key units. My approach is a tradeoff intended to balance out these competing factors.
Calculating Average Army Cost-Effectiveness
For each army, I calculated the average of the ‘Combined Cost-Effectiveness’ metric across the selected units. This average provides a measure of the overall cost-effectiveness of an army, considering both cost and performance. “Performance” in this case is “Unit on Unit combat skills,” which isn’t exactly the same as in-game effectiveness. For example, take an 80pt unit of snow foxes. They have 10 attacks on 5+, with def 2+ and a 9/11 nerve. They can’t kill virtually anything, and so on a points per elo basis, they’ll look horribly overcosted. But that isn’t why you take snow foxes in KoW: you take them because they’re great chaff to box out enemy units and die, as well as having the option to race out and grab tokens.
Ranking the Armies
Finally, I ranked the armies based on their average combined cost-effectiveness, providing a clear comparison of which armies generally offer the most value. Again, consider this value from the perspective of killing units, not from winning games. Things like unit strength, complicated synergies, and the impact of individuals (which I don’t consider in the Elo analysis) can dramatically influence the overall ranking of armies.
With those caveats out of the way, here is the quick cost-effectiveness ranking:
Army Cost-Effectiveness
| Rank | Army | Avg Cost-Effectiveness |
|---|---|---|
| 1 | Undead | 1.040 |
| 2 | Empire of Dust | 1.032 |
| 3 | Dwarfs | 0.997 |
| 4 | Abyssal Dwarfs | 0.974 |
| 5 | The Order of the Green Lady | 0.952 |
| 6 | Forces of the Abyss | 0.925 |
| 7 | Trident Realm of Neritica | 0.912 |
| 8 | Salamanders | 0.909 |
| 9 | Forces of Nature | 0.885 |
| 10 | Ratkin Slaves | 0.878 |
| 11 | Free Dwarfs | 0.858 |
| 12 | The Order of the Brothermark | 0.822 |
| 13 | The Herd | 0.808 |
| 14 | Goblins | 0.808 |
| 15 | Ogres | 0.784 |
| 16 | Twilight Kin | 0.783 |
| 17 | Orcs | 0.758 |
| 18 | Nightstalkers | 0.747 |
| 19 | Basileans | 0.721 |
| 20 | Varangur | 0.712 |
| 21 | League of Rhordia | 0.698 |
| 22 | Riftforged Orcs | 0.695 |
| 23 | Kingdoms of Men | 0.690 |
| 24 | Elves | 0.675 |
| 25 | Ratkin | 0.612 |
| 26 | Sylvan Kin | 0.581 |
| 27 | Northern Alliance | 0.576 |
| 28 | Halflings | 0.545 |
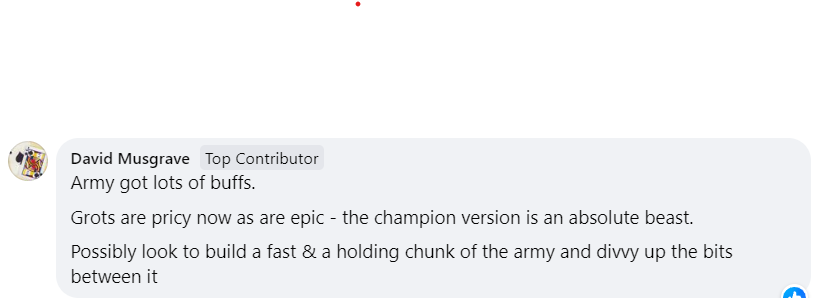
Some observations: first, the Abyssal Dwarfs (4) got some nice buffs and will be a solid army this year. They benefit from having outstanding infantry: in particular, the Blacksouls horde (25 attacks hitting on 4s, def 5, 21/23 with vicious for 190 points) and Immortal Guard regiment (12 attacks hitting on 3s, def 5, -/17, with vicious and regen 5+ for 160 points) are tough, cost-effective grind units. The 265-point Hellfane brings a ton of power and customization that lends itself to interesting strategic build choices as well. They’ve largely been absent from the tournament scene, but I think we’ll see a lot more of them in the future. Facebook commenters agree that they’ve gotten a strong upgrade:

The top two armies on the list, EoD and Undead, have much overlap as well. The changes to skeleton warriors make them more viable. A -/22 horde with 25 attacks on 5s and the ability to be surged–all for 140 points–along with lifeleech(1) give them significant staying power. They won’t one-shot anyone, but it’s extremely cheap unit strength and tarpit ability that requires an opponent to truly focus to take them out.
Second, many of the armies that are new(ish) score low on cost-effectiveness: Northern Alliance (27), Halflings (28), Riftforged Orcs (22), and Twilight Kin (16). I don’t think this reflects their true strength so much as the fact that they’re driven more by synergistic play and less by statlines. In other words, they’re armies with a high skill-cap, which creates some interesting possibilities for how to approach their use. As one example, the Northern Alliance has a new Tundra Fighters keyword, which allows for conditional vicious in certain situations, though it requires a thoughtful build (utilizing Clarion and units with Chilling Presence) to take advantage of. Without proper list building and then execution on the table, this can result in a lot of wasted points.
From a synergy perspective, I looked here at the creep of new keywords and complexity in the various factions. Each of these factions have more keywords than average: e.g. Northern Alliance has 44 keywords, Halflings have 33, and Twilight Kin has 35, all of which are near the top of the list. Further, the other two factions at the bottom, Ratkin and Sylvan Kin, have 35 and 33, respectively. This suggests to me that the Rules Committee has been very thoughtful in balancing synergies and statlines across factions, which is no mean feat.
What do you think? Will we see the meta make a meaningful shift? Leave a comment below.
Note: As I make changes to the underlying simulation function, I routinely re-run the simulations. I will try to update the table as I do that but am unlikely to tweak the text each time to match. So if you see inconsistencies, that’s because I’ve added a new rule to the simulation, corrected a data entry error, or made some other change.