First, congrats to our 2024 US Master, Ed Fisk! He had a great run through the tournament and played a number of entertaining games on the Dash28 livestream. For final standings, see here.
Introduction
Before the tournament began, I highlighted five key lists to watch, predicting they would be among the top performers. These lists were chosen based on their unique strengths, based on data analytics. As the tournament concluded, it’s time to evaluate how well these predictions held up against the actual results. As I have in prior years, I’ll have a full data recap coming in the next few weeks, but here are some quick thoughts.
The Five Lists
- Adam Ballard’s Trash Stalkers: A list focused on overwhelming numbers and psychological warfare, with 17 scoring units and a strong unit strength of 28.
- Mike Szedlmayer’s Nightstalkers: A variant of the Nightstalker list with a focus on resilience, boasting 359 shots to six nerve and backed by heal 14.
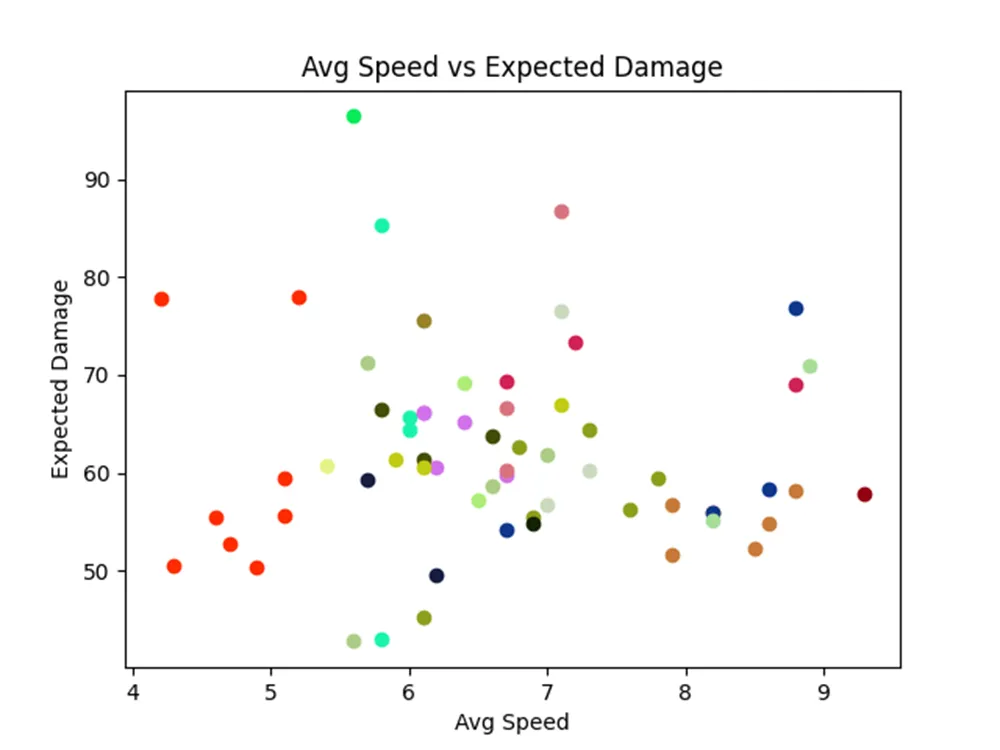
- Marcelo Rouco’s Green Lady: Known for its speed and powerful strikes, this list combines an average speed of 8.5 with 71.1 expected damage, making it a formidable alpha strike force.
- Gabe Toth’s Crystal Dwarves: Exemplifying Dwarven resilience, this list boasts 157 total attacks, A+ defense, and a slow but steady approach.
- Travis Timm’s Mountain Goblins: A classic horde list, with 24 units and 232 total attacks, designed to overwhelm opponents through sheer numbers.
How Did They Perform?
Out of these five selected lists, here’s how they ranked in the final standings:
- Gabe Toth (Mid-Atlantic) finished 4th overall.
- Adam Ballard (Mountain) finished 6th overall.
- Travis Timm (Mountain) finished 10th overall.
- Marcelo Rouco (Mid-Atlantic) finished 11th overall.
- Mike Szedlmayer (Mid-Atlantic) finished 22nd overall.
Clearly, the majority of my picks performed exceptionally well, with four out of five finishing in the top 20. But was this success merely a matter of luck, or was there something more to my predictions?
Statistical Analysis: Top 20 Cutoff
To assess the validity of my predictions, I first conducted a statistical analysis based on a top 20 cutoff. This means we examine how many of my picks finished within the top 20, compared to what we would expect if selections were made randomly.
- Number of my picks in the top 20: 4 out of 5
- Expected number of top 20 finishes by random chance: 1.56 (based on a 31.25% chance per pick)
Using a binomial test, I found a p-value of 0.036. This indicates there’s only a 3.6% chance that this result could occur if my picks were purely random. Thus, my selections were statistically significant and likely better than random chance.
Going Deeper: The Mann-Whitney U Test
While the top 20 cutoff gives us an initial idea, it’s somewhat arbitrary. To go a bit deeper, I used the Mann-Whitney U Test. This non-parametric test compares the ranks of my selected players to a distribution of randomly chosen ranks. The Mann-Whitney U Test is a widely used non-parametric test that compares two independent samples to determine whether they come from the same distribution. Here’s how it works:
- Ranking: First, all observations (in this case, player rankings) are combined and ranked.
- Summation: The ranks of each group (my picks vs. random picks) are summed.
- U-statistic Calculation: The U statistic is calculated based on the sum of ranks. It measures the degree of overlap between the two groups.
- P-value Interpretation: The p-value indicates the probability that the observed differences between the two groups occurred by chance. A low p-value (typically below 0.05) suggests that the observed differences are statistically significant.
The results were compelling:
- U-statistic: 845.0
- P-value: 0.005
This p-value suggests that there is only a 0.5% chance that the ranks of my picks would be as high as they were if they had been selected randomly. In other words, my predictions were significantly better than what would be expected by chance alone.
In this case, the test showed that my picks were significantly higher ranked than what would be expected from random picks, reinforcing the success of my selection strategy. Even at the Masters level, strong lists outperform weaker lists (though what makes a list strong is still open to a lot of interpretation).
Conclusion
The data backs up my predictions—my five lists to watch performed far better than random chance would predict. With four out of five lists finishing in the top 20, and statistical tests confirming the strength of these selections, it’s clear that my approach to identifying top-performing lists was both effective and insightful.
As the next tournament approaches, I’ll be applying these same principles, refining my analysis, and looking to identify the next set of top contenders.